Should I Go to that Wedding, or Not?
Well, the very cool folks at the Georgia Tech Applied Biometrics Lab have figured out a way to estimate just that.
They’ve released a Covid-19 Event Risk Assessment Planning Tool to show us the risk level of attending events of different sizes, in different locations.
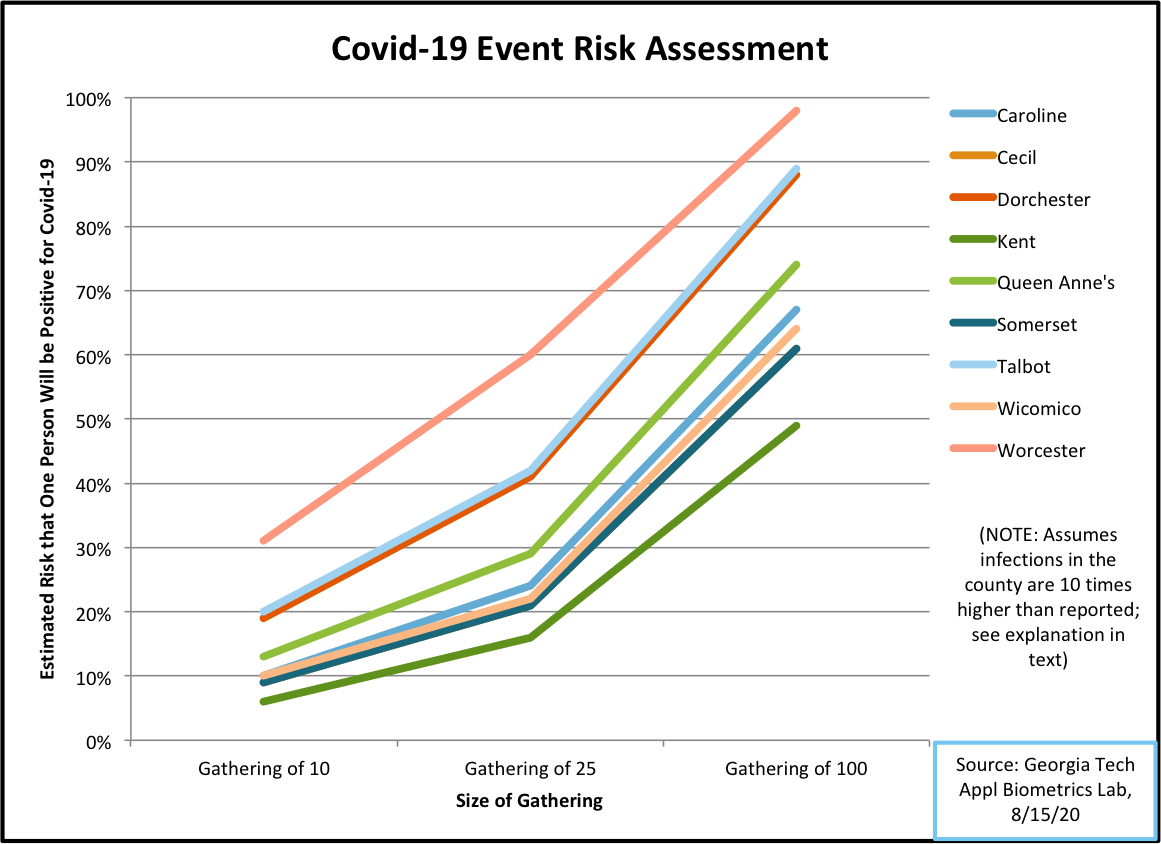
The risk level is the estimated chance (0–100 percent) that at least one person who is positive for covid-19 will be present at an event in a county, taking into consideration the number of people who are currently infectious in that county, and the number of people at the event.
For example, suppose you’ve been invited to a dinner party in Dorchester County where there will be 10 people. What are the chances that one of those people will be positive for covid-19?
Before we can answer that, we need to know how many more positive cases there are than have been reported. But how can we know that? Cases can be under-reported due to testing shortages, asymptomatic “silent spreaders,” and reporting lags.
The folks at Georgia Tech explain that based on antibody testing, they figure there are 10 times more cases in the country than are being reported. So we need a way to compensate for this (called an ascertainment bias), and they’ve built that into the tool.
Back to our dinner party. Assuming the Georgia Tech folks are correct, and there are 10 times the number of cases as have been reported in Dorchester County, the chance that one of the 10 dinner party guests will be positive for covid-19 is 19 percent.
This means only that there is a 19 percent chance that one person at the dinner party is infectious. It does not mean that you have a 19 percent risk of being exposed or infected at the event.
How are those things different? Well, even if there is an infected person at the dinner party, your risk of becoming infected would depend on factors such as whether people are social distancing, wearing masks, not singing, eating outside, not hugging, not sharing food, etc. The probability that you will be infected could be anywhere from 0–100 percent depending on those and other factors (although I’d bet against 0 percent), and there’s no way to calculate it.
Back again to our assumption about reporting accuracy. In areas where testing is more available, the infection level may be only 5 times higher than reported. If that is the case in Dorchester County, the risk level at our dinner party drops to 10 percent — there is a 10 percent chance that one person at the dinner party is infectious.
Let’s do another example — a 100-person party in Worcester County. If the infection rate in the county is 10 times that reported, there is a 98 percent chance that one person at the party is infectious. If the infection rate is 5 times that reported, the risk level is 84 percent. Again, this is not an estimate of whether you’ll be exposed or infected. But this tool gives us the opportunity to make informed decisions. If there is between an 84 and 98 percent chance that a covid-19 infected person will be at that party, it’s fairly certain that person will be there.
The Georgia Tech wizards warn that these calculations are estimates based on imperfect data. They also caution us to remember that super-spreading events (where one infected person transmits the virus to many others) have occurred and are still possible, no matter the size of the event.
These estimates are updated daily on the website. And the tool can estimate events of up to 10,000 people. So have a look — instructions are below. This is just one more way to try to deal with and make sense of this pandemic. Me? I’m staying home.
How to use the Covid-19 Event Risk Assessment Planning Tool:
- Go to: https://covid19risk.biosci.gatech.edu/
- NOTE: When you scroll, do NOT scroll in the map area, as this will unintentionally affect the map zoom.
- Scroll down and set Event Size in the left sidebar.
- Then set Ascertainment Bias to either 5 (5 times more infections in the county than reported) or 10 (10 times more infections).
- Scroll back up and use the ‘+’ to increase the map zoom; 3 times is good.
- Now the map will be centered in the Midwest, so drag the map toward the east coast so you can see the Eastern Shore.
- Just hover over the county you’re interested in to see the current risk level.
Chande, A.T., Gussler, W., Harris, M., Lee, S., Rishishwar, L., Jordan, I.K., Andris, C.M., and Weitz, J.S. 'Interactive COVID-19 Event Risk Assessment Planning Tool', http://covid19risk.biosci.gatech.edu/
Weitz, J.S., Harris, M., Chande, A.T., Gussler, J.W., Rishishwar, L. and Jordan, I.K. (2020) Online COVID-19 Dashboard Calculates How Risky Reopenings and Gatherings Can Be. Sci Am. https://blogs.scientificamerican.com/observations/online-covid-19-dashboard-calculates-how-risky-reopenings-and-gatherings-can-be/
Jan Plotczyk spent 25 years as a statistician with the federal government. She retired to Rock Hall.
Common Sense for the Eastern Shore


