What Accounts for Differing Vaccination Rates?

Jan Plotczyk • August 3, 2021
 
We would not expect every Eastern Shore county to have identical covid-19 vaccination rates, and they don’t — but what accounts for the differences that range from 43% to 65% vaccinated? We’ll look to politics, social vulnerability, and race/ethnicity for answers.

Vaccination Rate Differences and Politics

It’s been pretty well documented that there’s a correlation between covid-19 vaccination levels and 2020 presidential election voting patterns. Numbers show that, overall, states and counties that voted for Biden have higher vaccination rates than states and counties that voted for Trump.

Numerous polls (KFF, Monmouth, Washington Post-ABC News, and others) have consistently found that Republicans are much more likely to say that they definitely do not want to get vaccinated and Democrats are much more likely to report having been vaccinated.

Data show that the top 22 states (including D.C.) with the highest adult vaccination rates all went for Joe Biden in the 2020 presidential election. Maryland is number six on that list, as of July 28. Trump won 17 of the 18 states with the lowest adult vaccination rates. Almost all U.S. counties below 20 percent vaccination rates lean Republican, and almost all above 65 percent lean Democratic.

Do the nine counties of the Eastern Shore follow this pattern? Let’s look at the data for percent of total population that has gotten at least one shot, as of July 27. Because these are rates of total population, they are much lower than rates calculated with only adults.


The two counties that went for Biden — Talbot and Kent — have the highest (65.9%) and third highest (61.5%) vaccination rates in this group. Worcester County is the outlier — it went for Trump by 17 points, but has the second highest vaccination rate (63.1%). Wicomico County was close in the election; it went for Trump by only 1.9 points, but has the second lowest vaccination rate (47.3%) in this group.


For comparison, Maryland’s vaccination rate is 59.6%. In the U.S. it is 56.9%.


Overall, the pattern mostly holds true for the Eastern Shore counties, although it is not the case that vaccination rate is proportional to support of either candidate.


In the past few weeks, some GOP lawmakers and conservative media figures have changed course and are now encouraging hesitant people to get vaccinated. The current sudden rise of cases, hospitalizations, and deaths due to the extremely contagious and virulent delta variant is overwhelmingly in states and counties that have lower vaccination rates. CDC Director Rochelle Walensky called it a “pandemic of the unvaccinated.”


Vaccination Rates and Social Vulnerability Index


It is clear that vaccination rates for counties do not depend solely on partisanship. For an insight into what some of those other factors could be, let’s take a look at vaccination rates and the Social Vulnerability Index.


The Social Vulnerability Index was created by the Centers for Disease Control and Prevention more than 20 years ago to help emergency response planners and public health officials identify and map communities that will most likely need support before, during, and after a hazardous event. The coronavirus pandemic is one such hazardous event.


The index assesses four themes in each community — socioeconomic status, household composition and disability, minority status and language, and housing type and transportation. Scores are used to determine the degree to which these factors would influence the ability of local officials to react effectively to disasters and disease outbreaks.


Scores are generated at the overall county level and for each theme. They are ranked on a scale of 0 to 1, with 1 being the most vulnerable.


Social Vulnerability Index Themes Defined:


We would expect to see that counties with higher social vulnerability scores would have lower vaccination rates, due to difficulties in reaching populations of elderly residents, people with limited English proficiency, those without transportation, etc.


Queen Anne's County has a Social Vulnerability Index of 0.00 in the chart above — the lowest vulnerability score. We see that the four counties with the lowest social vulnerability scores — Talbot, Worcester, Kent, and Queen Anne’s — have the four highest vaccination rates in the group. The five counties with the highest vulnerability scores have the lowest vaccination rates in the group.


Vaccination Rate Disparity by Race/Ethnicity


Finally, what role does race/ethnicity play in vaccination rates? Unfortunately, there are no public data on vaccination status by race/ethnicity at the county level, so we’ll have to look at Maryland as a whole.


The Kaiser Family Foundation looked at vaccinations by race/ethnicity for the 40 states that reported those data. They found that across all these states, the percent of White people who have received at least one covid-19 vaccine dose (48%) was roughly 1.3 times higher than the rate for Black people (36%) and 1.2 times higher than the rate for Hispanic people (41%) as of July 19.


Maryland has done a bit better. Higher percentages of each group have been vaccinated compared with the 40-state composite, but disparities still exist. The percent of White people who have received at least one dose as of July 19 is 61%. This is 1.2 times higher than the rate for Black people (51%) and 1.1 times higher than the rate for Hispanic people (54%).


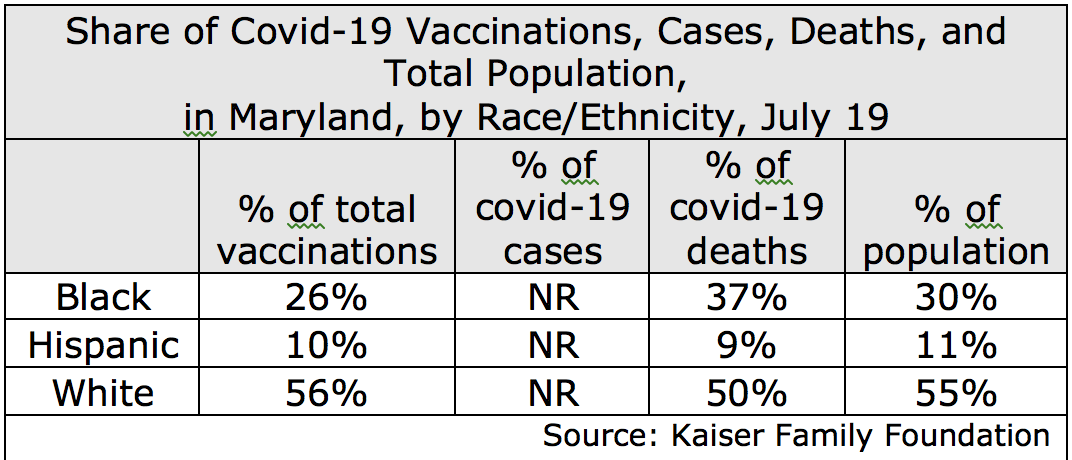
Black people account for 30% of Maryland’s population, but only 26% of total vaccinations; 37% of covid deaths were among Black people. Covid-19 cases were not reported by race/ethnicity in Maryland.


Hispanic people account for 11% of Maryland’s population, but only 10% of total vaccinations; 9% of covid deaths were among Hispanic people.


White people account for 55% of Maryland’s population and 56% of total vaccinations; 50% of covid deaths were among Whites.


The share of vaccinated Black and Hispanic people has been growing recently relative to White people.


Recent surveys reveal that the population of unvaccinated can actually be subset into two groups: those who are adamant in their refusal of the vaccine (the “definitely nots” — 45% of unvaccinated), and those who are open to being persuaded (the “wait and sees” — 35% of unvaccinated). The former group is overwhelmingly White, Republican, and younger, and represents 15% of Americans; the latter group includes many younger people, Black and Hispanic Americans, and Democrats.


Among the “definitely nots, ” 83% believe that the seriousness of covid-19 is exaggerated, and 88% are not worried about getting sick from covid. Among the “wait and sees,” 78% believe the vaccines are not as safe as they are said to be, 44% say they would be more likely to get vaccinated if the vaccines gained FDA approval (rather than provisional approval), and 46% state they would be more likely to get vaccinated if they could do it at their own doctor’s office.


There didn’t look like there was much hope of vaccinating our way out of this pandemic voluntarily. But people may be changing their minds — vaccinations have recently risen in areas hard hit by the delta variant. And lately, some private companies, some local and state governments, and the federal government have decided to require that employees either be vaccinated or wear masks and social distance and get tested weekly or more often. A few private companies are making vaccination a condition of employment. And some businesses (restaurants and theaters, for example) are requiring their patrons be vaccinated. This may be the way out of the mess we’re in.


Sources:

The Red/Blue Divide in COVID-19 Vaccination Rates is Growing. Jennifer Kates, Jennifer Tolbert, Kendal Orgera, Kaiser Family Foundation.

https://www.kff.org/policy-watch/the-red-blue-divide-in-covid-19-vaccination-rates-is-growing/


KFF Covid-19 Vaccine Monitor.

https://www.kff.org/coronavirus-covid-19/dashboard/kff-covid-19-vaccine-monitor-dashboard/


Monmouth University Poll.

https://www.monmouth.edu/polling-institute/documents/monmouthpoll_us_062321.pdf/


A Third of White Conservatives Refuse to get Vaccinated. Philip Bump, Washington Post.

https://www.washingtonpost.com/politics/2021/07/06/third-white-conservatives-refuse-get-vaccine-refusal-shown-both-polling-real-world/


States ranked by percentage of population fully vaccinated: July 28. Katie Adams, Becker’s Hospital Review.

https://www.beckershospitalreview.com/public-health/states-ranked-by-percentage-of-population-vaccinated-march-15.html


The 4 main fault lines that divide the vaccinated from the unvaccinated. Umair Irfan, Vox

https://www.vox.com/22587443/covid-19-vaccine-refusal-hesitancy-variant-delta-cases-rate


2020 U.S. County Level Presidential Results. Tony McGovern.

https://github.com/tonmcg/US_County_Level_Election_Results_08-20/blob/master/2020_US_County_Level_Presidential_Results.csv


COVID-19 Integrated County View. CDC, July 27, 2021

https://covid.cdc.gov/covid-data-tracker/#county-view


Covid-19 Vaccine Equity

https://covid.cdc.gov/covid-data-tracker/#vaccination-equity


At A Glance: CDC/ATSDR Social Vulnerability Index.

https://www.atsdr.cdc.gov/placeandhealth/svi/at-a-glance_svi.html


CDC/ATSDR SVI Data and Documentation Download.

https://www.atsdr.cdc.gov/placeandhealth/svi/data_documentation_download.html


Latest Data on COVID-19 Vaccinations by Race/Ethnicity.

Nambi Ndugga, Olivia Pham, Latoya Hill, Samantha Artiga, Noah Parker, Kaiser Family Foundation.

https://www.kff.org/coronavirus-covid-19/issue-brief/latest-data-on-covid-19-vaccinations-race-ethnicity/


KFF COVID-19 Vaccine Monitor: Profile Of The Unvaccinated. Grace Sparks, Ashley Kirzinger, Mollyann Brodie, Kaiser Family Foundation.

https://www.kff.org/coronavirus-covid-19/poll-finding/kff-covid-19-vaccine-monitor-profile-of-the-unvaccinated/


AP Poll Finds 45% of Unvaccinated Americans say they will definitely not get a shot. Boston Globe, July 23.

https://www.bostonglobe.com/2021/07/23/nation/associated-press-poll-finds-45-unvaccinated-americans-say-they-will-definitely-not-get-shot/


As Delta surges, poll data suggests that unvaccinated America’s opposition to the shots is declining, IPSOS.

https://www.ipsos.com/en-us/news-polls/axios-ipsos-coronavirus-index


Jan Plotczyk spent 25 years as a survey and education statistician with the federal government, at the Census Bureau and the National Center for Education Statistics. She retired to Rock Hall.


Common Sense for the Eastern Shore

By CSES Staff October 24, 2025
 Sparking alarm among housing advocates, social workers, and residents, Salisbury Mayor Randy Taylor has announced plans to gut Salisbury’s nationally recognized Housing First program, signaling a break from years of bipartisan progress on homelessness. Created in 2017 under then-Mayor Jacob Day, the initiative was designed around a simple but powerful principle: that stable, permanent housing must come first before residents can address problems with employment, health, or recovery. The program was designed to provide supportive housing for Salisbury’s most vulnerable residents — a model backed by decades of national data showing it reduces homelessness, saves taxpayer dollars, and lowers strain on emergency services. But under Taylor’s leadership, that vision appears to be ending. In a letter to residents, the City of Salisbury announced that the Housing First program will be shut down in 2027, in effect dismantling one of the city’s long-term programs to prevent homelessness. Taylor says he plans to “rebrand” the program as a temporary “gateway to supportive housing,” shifting focus away from permanent stability and toward short-term turnover. “We’re trying to help more people with the same amount of dollars,” Taylor said. Critics call that reasoning deeply flawed, and dangerous. Former Mayor Jacob Day, who helped launch the initiative, says that Housing First was always intended to be permanent supportive housing, not a revolving door. National studies show that when cities replace permanent housing programs with short-term placements, people end up right back on the streets, and that costs taxpayers more in emergency medical care, policing, and crisis intervention. Local advocates warn that Taylor’s move will undo years of progress. “This isn’t just a policy shift, it’s a step backward,” one social service worker said. “Housing First works because it’s humane and cost-effective. This administration is turning it into a revolving door to nowhere.” Even some community partners who agree the program needs better oversight say that Taylor is missing the point. Anthony Dickerson, Executive Director of Salisbury’s Christian Shelter, said the city should be reforming and strengthening its approach, not abandoning its foundation. Under Taylor’s proposal, participants could be limited to one or two years in housing before being pushed out, whether or not they’re ready. Advocates fear this change could push vulnerable residents back into instability, undoing the progress the city was once praised for. While Taylor touts his plan as a way to “help more people,” critics say it reflects a troubling pattern in his administration: cutting programs that work. For years, Salisbury’s Housing First initiative has symbolized compassion and evidence-based leadership and has stood as a rare example of a small city tackling homelessness with dignity and results. Now, as Taylor moves to end it, residents and advocates are asking a simple question: Why would a mayor tear down one of Salisbury’s most successful programs for helping people rebuild their lives?
By John Christie October 24, 2025
On the first Monday of October, the Supreme Court began a new term, Term 2025 as it is officially called. The day also marked John Roberts’ 20 years as Chief Justice of what history will clearly record as the Roberts Court. Twenty years is a long time but at this point, Roberts is only the fourth longest serving Chief Justice in our history. John Marshall, the fourth and longest, served for 34 years, 152 days (1801–35). Roger Brooke Taney, served for 28 years, 198 days (1836–64). Melville Fuller, served 21 years, 269 days (1888 to 1910). John Roberts was originally nominated by George W. Bush to fill the seat held by the retiring Sandra Day O’Connor but, upon the unexpected death of William Rehnquist, Bush instead nominated Roberts to serve as Chief Justice. His nomination was greeted by enthusiasm and high hopes in many quarters. He was young, articulate, personable, and highly qualified, having had an impressive academic record, experience in the Reagan administration and the private bar, and service on the federal D.C. Court of Appeals for two years. His “balls and strikes” comment at his confirmation hearing struck many as suggesting judicial independence. He sounded as well very much like an institutionalist, having said at an early interview that “it would be good to have a commitment on the part of the Court to act as a Court.” Whatever else might be said 20 years later about the tenure of John Roberts as Chief Judge, the Supreme Court is no doubt much less popular and much more divisive today than it was on September 29, 2005, when he was sworn in as the 17th Chief Justice by Justice John Paul Stevens, then the Court’s most senior associate justice, and witnessed by his sponsor, George W. Bush. Gallup’s polling data shows popular support for the Court now at the lowest levels since they started measuring it. In July 2025, a Gallup poll found that, for the first time in the past quarter-century, fewer than 40% of Americans approved of the Supreme Court’s performance. According to Gallup, one major reason that approval of the Supreme Court has been lower is that its ratings have become increasingly split along party lines — the current 65-point gap in Republican (79%) and Democratic (14%) approval of the court is the largest ever. The legal scholar Rogers Smith wrote in The Annals of the American Academy of Political and Social Science in June, “Roberts’s tenure as Chief Justice has led to the opposite of what he has said he seeks to achieve. The American public now respects the Court less than ever and sees it as more political than ever.” These results signify more than simply a popularity poll because a Court without broad public support is a Court that will not have the same public respect upon which their most important decisions have historically depended. And, whatever the reasons for this development, it has happened on John Roberts’s watch. There is no better example of the current divisiveness on the Court than the remarkable string of “emergency” rulings on the Court’s so-called shadow docket since January 20. The extent of ideological and partisan differences has been sharp and extreme. The conservative majority’s votes have frequently been unexplained, leaving lower court judges to have to puzzle the decision’s meaning and leaving the public to suspect partisan influences. And the results of these shadow docket rulings have had enormous, sometimes catastrophic, consequences: Removing noncitizens to countries to which they had no ties or faced inhumane conditions Disqualifying transgender service members Firing probationary federal workers and independent agency heads Ending entire governmental departments and agencies without congressional approval Allowing the impounding of foreign aid funds appropriated by Congress Releasing reams of personal data to the Department of Government Efficiency Allowing immigration raids in California based on racial and ethnic profiling John Roberts has written many Supreme Court opinions in his 20 years as Chief Justice. At the 20-year mark, the most important, to the nation and to his legacy, will likely be his opinion in the Trump immunity case, which changed the balance of power among the branches of government, tipping heavily in the direction of presidential power. Trump v. United States (2024). In her dissent from his majority opinion in that case, Justice Sonia Sotomayor, joined by Justices Elena Kagan and Ketanji Brown Jackson, warned about the consequences of such a broad expansion of presidential power. “The Court effectively creates a law-free zone around the president,” upsetting the status quo that had existed since the nation’s founding and giving blanket permission for wrongdoing. “Let the president violate the law, let him exploit the trappings of his office for personal gain, let him use his official power for evil ends. In every use of official power, the president is now a king above the law.” Roberts claimed in his majority opinion that the “tone of chilling doom” in Sotomayor’s dissent was “wholly disproportionate” to what the ruling meant. However, Sotomayor’s words have proved prescient: the breadth of power that Trump and his administration have asserted in the months since he was sworn in for his second term has made plain how boundlessly they now interpret the reach of the presidency in the wake of the Roberts opinion. Despite the early “balls and strikes” comment, the assessment of John Roberts’ long term judicial record suggests something different as seen by several distinguished legal commentators from significantly different perspectives. As summarized by Lincoln Caplan, a senior research scholar at Yale Law School, in a new retrospective article on Robert’s 20-year tenure, “From his arrival on the Court until now, his leadership, votes, and opinions have mainly helped move the law and the nation far to the right. An analysis prepared by the political scientists Lee Epstein, Andrew Martin, and Kevin Quinn found that in major cases, the Roberts Court’s record is the most conservative of any Supreme Court in roughly a century.” “What Trump Means for John Roberts's Legacy,” Harvard Magazine , October 8, 2025. Steve Vladeck, Georgetown Law Center professor and a regularly incisive Court commentator, characterized the 20-year Roberts’ Court as follows: “The ensuing 20 years has featured a Court deciding quite a lot more than necessary — inserting itself into hot-button social issues earlier than necessary (if it was necessary at all); moving an array of previously settled statutory and constitutional understandings sharply to the right; and, over the past decade especially, running roughshod over all kinds of procedural norms that previously served to moderate many of the justices’ more extreme impulses.” “The Roberts Court Turns Twenty,” One First , September 29, 2025. In another remarkable new article by a widely respected conservative originalist, similar concerns about the present Court have very recently been expressed. Caleb Nelson, who teaches at the University of Virginia and is a former law clerk to Justice Clarence Thomas, has written that the text of the Constitution and the historical evidence surrounding it in fact grant Congress broad authority to shape the executive branch, including by putting limits on the president’s power to fire people. “Must Administrative Officers Serve at the President’s Pleasure?” Democracy Project, NYU LAW , September 29, 2025. When the First Congress confronted similar ambiguities in the meaning of the Constitution, asserts Nelson, “more than one member warned against interpreting the Constitution in the expectation that all presidents would have the sterling character of George Washington.” Nelson continues, “The current Supreme Court may likewise see itself as interpreting the Constitution for the ages, and perhaps some of the Justices take comfort in the idea that future presidents will not all have the character of Donald Trump. But the future is not guaranteed; a president bent on vengeful, destructive, and lawless behavior can do lasting damage to our norms and institutions.” John Christie was for many years a senior partner in a large Washington, D.C. law firm. He specialized in anti-trust litigation and developed a keen interest in the U.S. Supreme Court about which he lectures and writes. 
By Jan Plotczyk October 24, 2025
If you’ve ever wondered just how slavishly loyal Rep. Andrew P. Harris (R-MD01) is to President Donald Trump, you can now put a number on it! Just consult the Republican National Platform Ratings. When you do, you will find that Rep. Harris has a very high overall score: 90.38%. He is the most aligned with the Trump/GOP platform among Maryland’s congressional representatives. No surprise there. Among all U.S. senators and representatives (using 2024 votes), Harris is 43rd most aligned. One might expect more from the chair of the right-wing Freedom Caucus. Harris scores at 90.38% aligned overall. His ratings by topic range from 82.98% to 100%. The topics refer to chapters in the platform: Defeat inflation and quickly bring down all prices. Seal the border and stop the migrant invasion. Build the greatest economy in history. Bring back the American Dream and make it affordable again for families, young people, and everyone. Protect American workers and farmers from unfair trade. Protect our Constitution and seniors. Cultivate great K-12 schools leading to great jobs and great lives for young people. Bring common sense to our government and renew the pillars of American civilization. Government of, by, and for the people. Return to peace through strength. Here are all Harris’s scores:
By CSES Staff October 24, 2025
Several thousand people turned out on Oct. 18 in communities across the Eastern Shore to participate in the national “No Kings Day” protests, joining thousands of simultaneous events nationwide opposing the policies of President Trump’s administration. Demonstrations were held in Salisbury, Ocean City, Easton, Cambridge, Chestertown, and Centreville. These gatherings were part of a broader coalition effort that organizers say reflects frustration with the administration’s direction and a demand for renewed accountability and democracy. Participants across the Shore held signs and expressed concerns about immigration enforcement, executive power, and transparency in government. In jurisdictions that lean Republican and supported Trump in 2024, the rallies underscore a growing discrepancy between voting patterns and present activism. For example, in Queen Anne’s County — where the Trump vote was strong — residents joined the demonstration with statements of surprise at the turnout. Despite the scale of national mobilization, local organizers emphasized that the protest is rooted in community values of fairness, participation, and civic voice. One organizer on the Shore described the event as a reminder that “when people choose to show up, they remind their communities what democracy looks like.” Authorities reported no major disruptions during the Shore events, and police in some areas confirmed the rallies proceeded peacefully. For many in the region, the demonstrations mark an opening moment for more active civic engagement on the Shore, one that observers say could reshape local politics in counties historically seen as less partisan.
By CSES Staff October 24, 2025
The Maryland Democratic Party has launched a statewide initiative, Contest Every Seat, that aims to recruit candidates to run for public office across all levels of government ahead of the 2026 elections. Party officials say the goal is to ensure voters in every district across Maryland have a choice on the ballot. The program will include outreach, training sessions, and support for prospective candidates considering campaigns for local, county, and state positions. “The effort is designed to encourage Marylanders who want to make change in their communities to step up and take action,” the party announced. Interested individuals can visit mddems.org/run for information about the application process and training opportunities. The Maryland Democratic Party said similar initiatives in past election cycles helped increase candidate recruitment in local and rural areas, including the Eastern Shore.
By CSES Staff October 24, 2025
With the federal government now shut down for more than three weeks, Maryland is losing hundreds of thousands of dollars in revenue daily, a reflection of the state’s deep economic ties to the federal workforce. According to the Maryland Comptroller, approximately 230,000 Marylanders work directly for the federal government, with an additional 200,000 employed by federal contractors. The state’s economy, long intertwined with the operations of nearby federal agencies, is feeling the strain as paychecks stall and agencies close. Comptroller Brooke Lierman estimates Maryland is losing about $700,000 in state revenue each day — roughly one percent of the state’s average daily revenue of $100 million. “That is a small piece of our overall state budget,” Lierman said, “but as long as all our federal workers are paid what they are owed, that money will get back to us.” Federal employees generally receive back pay after shutdowns end, but recent statements from President Trump suggesting that furloughed workers may not be repaid have created uncertainty. More than 150 members of Congress, including Maryland’s entire Democratic delegation, signed a letter this week urging the Trump administration to guarantee back pay under the 2019 Government Employee Fair Treatment Act, which requires compensation for federal employees affected by a shutdown, and which Trump himself signed into law. Rep. Sarah Elfreth (D-MD03) said Congress is prepared to defend those protections. “Denying that pay would be illegal, and we will use every tool we have — both in Congress and in the courts — to ensure federal employees are made whole,” she said. During the 35-day federal shutdown in 2019, Maryland lost more than $13 million daily in economic activity and over $550,000 daily in tax revenue, according to state data. This latest shutdown comes amid broader federal workforce reductions under the U.S. Department of Government Efficiency, which announced layoffs earlier this year. A federal judge temporarily halted further cuts on Oct. 15 following a legal challenge. The effects extend beyond government offices. Universities such as Johns Hopkins and the University of Maryland Baltimore Washington Medical Center report disruptions to federally funded research projects and grant cycles. Gov. Wes Moore has directed state agencies to provide emergency support to furloughed federal workers, including housing and utility assistance. On Oct. 17, Moore announced the Maryland Transit Administration will offer free MARC and commuter bus rides to federal employees who show valid government ID. “This is what Maryland does in times of crisis, we band together and help each other out,” Moore said. “But no state can fill the gap created by the federal government. The longer this shutdown lasts, the more pain we will feel.” There is no indication of when negotiations in Washington to end the shutdown will resume.
Show More